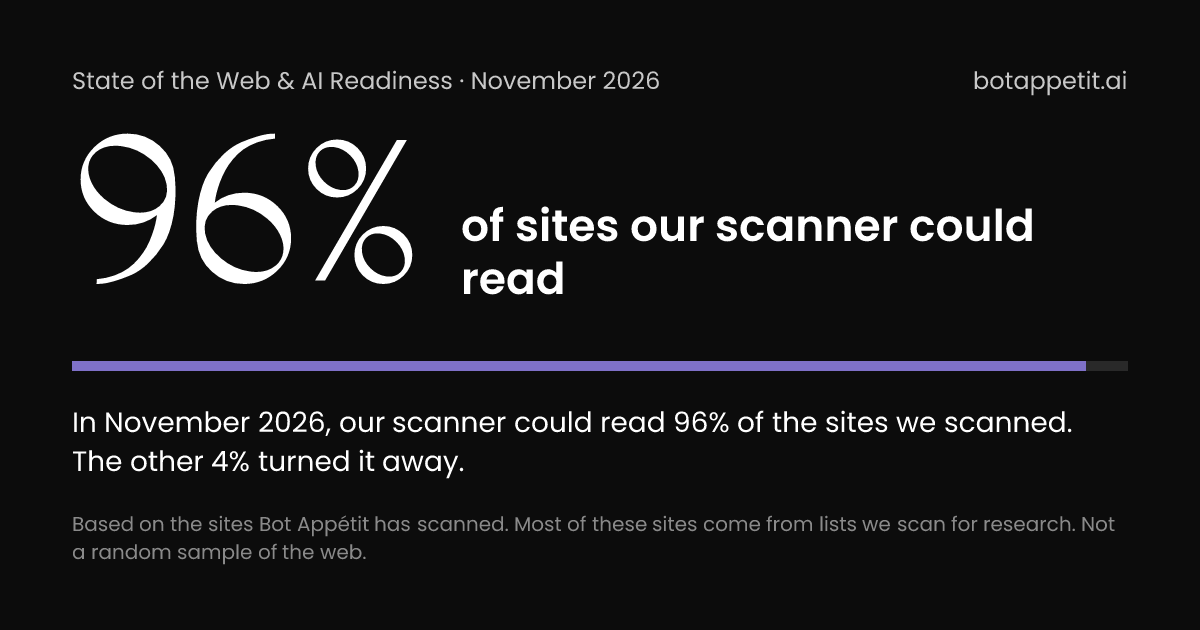
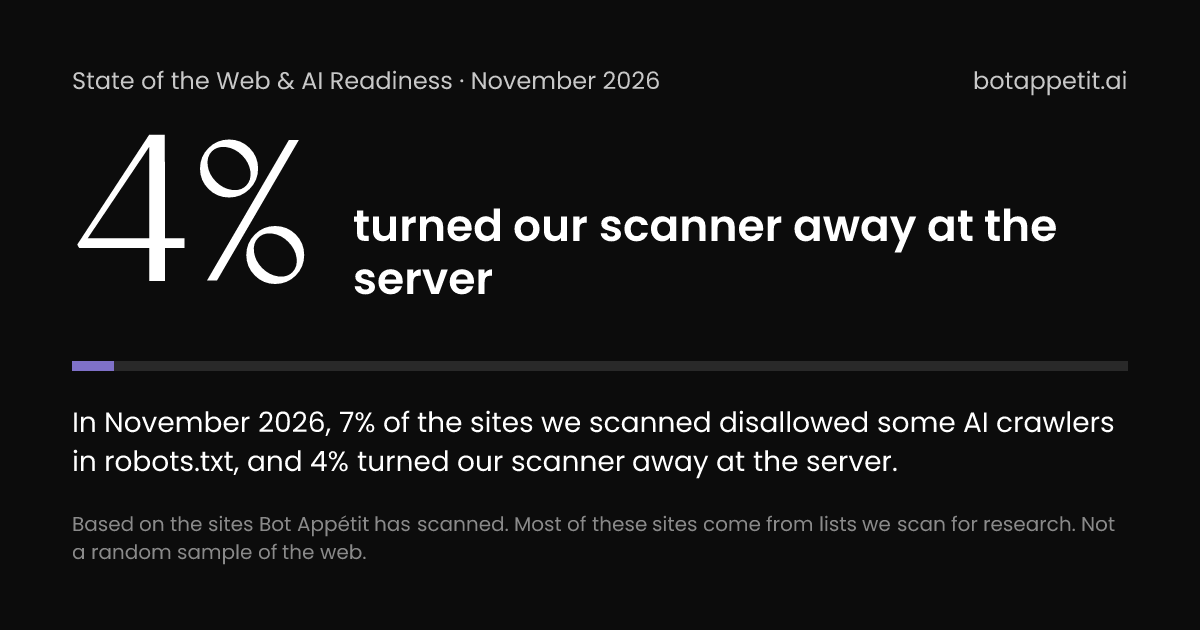
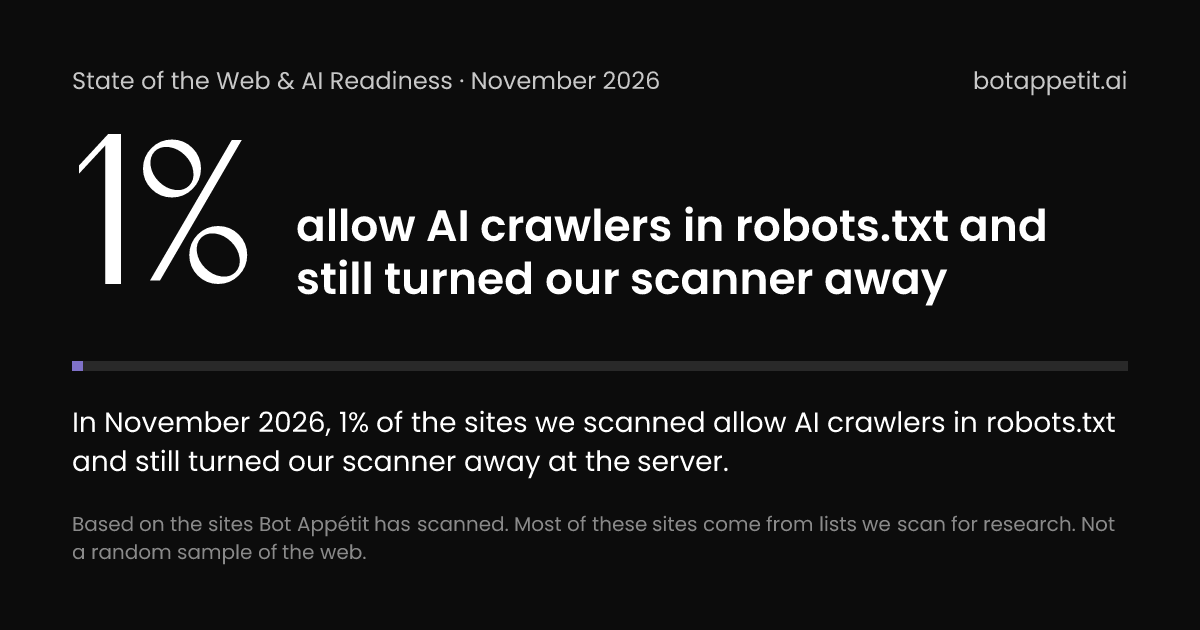
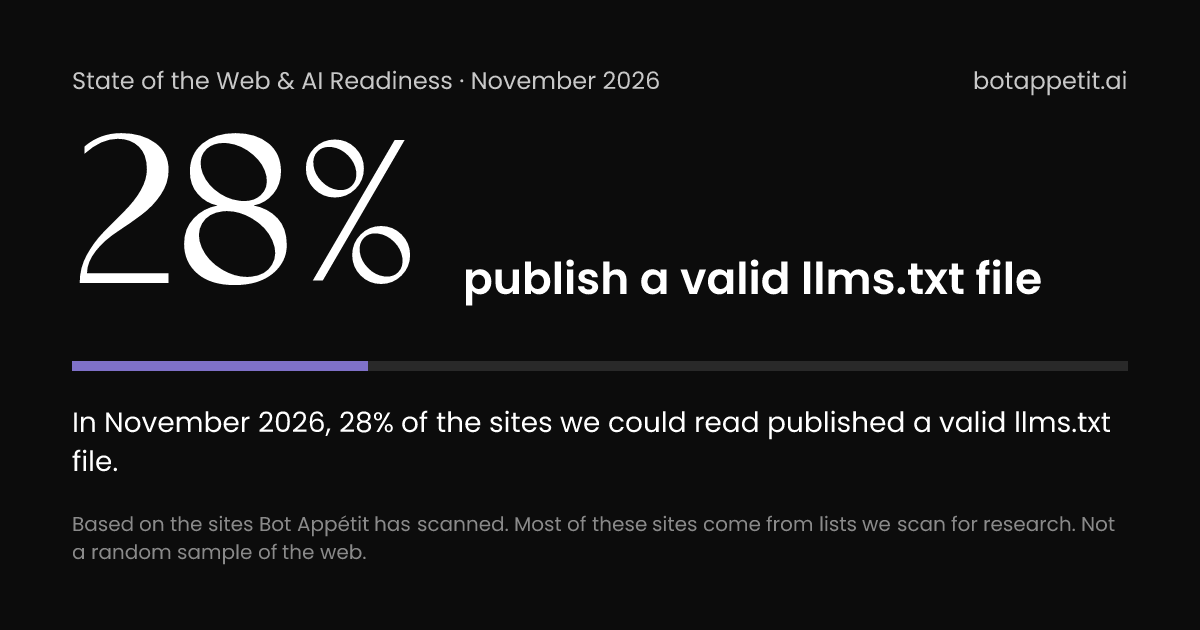
These lines count the sites scanned in each calendar month, so a month's figure can differ from the headline figures above, which use each
site's latest scan from the last three months. The “All sites” column is every site scanned that month, including sites added since, so a
change there can be a different crowd being scanned.
“Same sites” is every month for the one group of sites scanned in both the first month with a figure and the latest month, so a change
there is the sites themselves changing.
Agent Skills index
Counting every site scanned in November 2026, 7% of the sites we could read passed the “Agent Skills index” check. On the sites scanned in both October 2026 and November 2026, the share went from 9% to 8%.
Line: Same sites Line: All sites (new ones included)
Show as a table
Agent Skills index, share of sites by month | Month | Applies to | All sites (new ones included) | Same sites |
|---|
| October 2026 | 100% | 1% | 9% |
| November 2026 | 100% | 7% | 8% |
API catalog
Counting every site scanned in November 2026, 7% of the sites we could read passed the “API catalog” check. On the sites scanned in both October 2026 and November 2026, the share stayed at 7%.
Line: Same sites Line: All sites (new ones included)
Show as a table
API catalog, share of sites by month | Month | Applies to | All sites (new ones included) | Same sites |
|---|
| October 2026 | 100% | 1% | 7% |
| November 2026 | 100% | 7% | 7% |
Auth.md agent registration
Counting every site scanned in November 2026, 4% of the sites we could read passed the “Auth.md agent registration” check. On the sites scanned in both October 2026 and November 2026, the share went from 5% to 4%.
Line: Same sites Line: All sites (new ones included)
Show as a table
Auth.md agent registration, share of sites by month | Month | Applies to | All sites (new ones included) | Same sites |
|---|
| October 2026 | 100% | <1% | 5% |
| November 2026 | 100% | 4% | 4% |
AI discovery via DNS
Counting every site scanned in November 2026, 0% of the sites we could read passed the “AI discovery via DNS” check. On the sites scanned in both October 2026 and November 2026, the share stayed at 0%.
Line: Same sites Line: All sites (new ones included)
Show as a table
AI discovery via DNS, share of sites by month | Month | Applies to | All sites (new ones included) | Same sites |
|---|
| October 2026 | 100% | <1% | 0% |
| November 2026 | 100% | 0% | 0% |
MCP Server Card
Counting every site scanned in November 2026, 11% of the sites we could read passed the “MCP Server Card” check. On the sites scanned in both October 2026 and November 2026, the share stayed at 12%.
Line: Same sites Line: All sites (new ones included)
Show as a table
MCP Server Card, share of sites by month | Month | Applies to | All sites (new ones included) | Same sites |
|---|
| October 2026 | 100% | 1% | 12% |
| November 2026 | 100% | 11% | 12% |
OAuth authorization-server metadata
Counting every site scanned in November 2026, 15% of the sites we could read passed the “OAuth authorization-server metadata” check. On the sites scanned in both October 2026 and November 2026, the share went from 16% to 15%.
Line: Same sites Line: All sites (new ones included)
Show as a table
OAuth authorization-server metadata, share of sites by month | Month | Applies to | All sites (new ones included) | Same sites |
|---|
| October 2026 | 100% | 2% | 16% |
| November 2026 | 100% | 15% | 15% |
OAuth protected-resource metadata
Counting every site scanned in November 2026, 9% of the sites we could read passed the “OAuth protected-resource metadata” check. On the sites scanned in both October 2026 and November 2026, the share stayed at 10%.
Line: Same sites Line: All sites (new ones included)
Show as a table
OAuth protected-resource metadata, share of sites by month | Month | Applies to | All sites (new ones included) | Same sites |
|---|
| October 2026 | 100% | 2% | 10% |
| November 2026 | 100% | 9% | 10% |
OpenID Connect discovery
Counting every site scanned in November 2026, 7% of the sites we could read passed the “OpenID Connect discovery” check. On the sites scanned in both October 2026 and November 2026, the share stayed at 7%.
Line: Same sites Line: All sites (new ones included)
Show as a table
OpenID Connect discovery, share of sites by month | Month | Applies to | All sites (new ones included) | Same sites |
|---|
| October 2026 | 100% | 2% | 7% |
| November 2026 | 100% | 7% | 7% |
Web Bot Auth (operates a signed bot)
Counting every site scanned in November 2026, 1% of the sites we could read passed the “Web Bot Auth (operates a signed bot)” check. On the sites scanned in both October 2026 and November 2026, the share stayed at 1%.
Line: Same sites Line: All sites (new ones included)
Show as a table
Web Bot Auth (operates a signed bot), share of sites by month | Month | Applies to | All sites (new ones included) | Same sites |
|---|
| October 2026 | 100% | <1% | 1% |
| November 2026 | 100% | 1% | 1% |
AI bot rules are explicit and intentional
Counting every site scanned in November 2026, 25% of the sites we could read passed the “AI bot rules are explicit and intentional” check. On the sites scanned in both October 2026 and November 2026, the share went from 24% to 26%.
Line: Same sites Line: All sites (new ones included)
Show as a table
AI bot rules are explicit and intentional, share of sites by month | Month | Applies to | All sites (new ones included) | Same sites |
|---|
| October 2026 | 100% | 11% | 24% |
| November 2026 | 100% | 25% | 26% |
AI crawlers aren't blocked
Counting every site scanned in November 2026, 75% of the sites we could read passed the “AI crawlers aren't blocked” check. On the sites scanned in both August 2026 and November 2026, the share went from 77% to 75%.
Line: Same sites Line: All sites (new ones included)
Show as a table
AI crawlers aren't blocked, share of sites by month | Month | Applies to | All sites (new ones included) | Same sites |
|---|
| August 2026 | 100% | 78% | 77% |
| September 2026 | 100% | 81% | 77% |
| October 2026 | 100% | 95% | 77% |
| November 2026 | 100% | 75% | 75% |
Analytics is installed
Counting every site scanned in November 2026, 50% of the sites we could read passed the “Analytics is installed” check. On the sites scanned in both October 2026 and November 2026, the share went from 49% to 51%.
Line: Same sites Line: All sites (new ones included)
Show as a table
Analytics is installed, share of sites by month | Month | Applies to | All sites (new ones included) | Same sites |
|---|
| October 2026 | 100% | 77% | 49% |
| November 2026 | 100% | 50% | 51% |
Descriptive anchor text
Counting every site scanned in November 2026, 97% of the sites where it applies (95% of the sites we could read) passed the “Descriptive anchor text” check. On the sites scanned in both October 2026 and November 2026, the share stayed at 98%.
Line: Same sites Line: All sites (new ones included)
Show as a table
Descriptive anchor text, share of sites by month | Month | Applies to | All sites (new ones included) | Same sites |
|---|
| October 2026 | 98% | 99% | 98% |
| November 2026 | 95% | 97% | 98% |
Author / publisher is clear
Counting every site scanned in November 2026, 53% of the sites we could read passed the “Author / publisher is clear” check. On the sites scanned in both October 2026 and November 2026, the share stayed at 53%.
Line: Same sites Line: All sites (new ones included)
Show as a table
Author / publisher is clear, share of sites by month | Month | Applies to | All sites (new ones included) | Same sites |
|---|
| October 2026 | 100% | 50% | 53% |
| November 2026 | 100% | 53% | 53% |
No broken links
Counting every site scanned in November 2026, 85% of the sites where it applies (94% of the sites we could read) passed the “No broken links” check. On the sites scanned in both October 2026 and November 2026, the share went from 91% to 88%.
Line: Same sites Line: All sites (new ones included)
Show as a table
No broken links, share of sites by month | Month | Applies to | All sites (new ones included) | Same sites |
|---|
| October 2026 | 98% | 88% | 91% |
| November 2026 | 94% | 85% | 88% |
Caching or validation headers are set
Counting every site scanned in November 2026, 83% of the sites we could read passed the “Caching or validation headers are set” check. On the sites scanned in both October 2026 and November 2026, the share stayed at 85%.
Line: Same sites Line: All sites (new ones included)
Show as a table
Caching or validation headers are set, share of sites by month | Month | Applies to | All sites (new ones included) | Same sites |
|---|
| October 2026 | 100% | 96% | 85% |
| November 2026 | 100% | 83% | 85% |
This page declares its canonical URL
Counting every site scanned in November 2026, 72% of the sites we could read passed the “This page declares its canonical URL” check. On the sites scanned in both October 2026 and November 2026, the share went from 72% to 73%.
Line: Same sites Line: All sites (new ones included)
Show as a table
This page declares its canonical URL, share of sites by month | Month | Applies to | All sites (new ones included) | Same sites |
|---|
| October 2026 | 100% | 57% | 72% |
| November 2026 | 100% | 72% | 73% |
The site settles on one host (www vs non-www)
Counting every site scanned in November 2026, 82% of the sites we could read passed the “The site settles on one host (www vs non-www)” check. On the sites scanned in both October 2026 and November 2026, the share went from 80% to 81%.
Line: Same sites Line: All sites (new ones included)
Show as a table
The site settles on one host (www vs non-www), share of sites by month | Month | Applies to | All sites (new ones included) | Same sites |
|---|
| October 2026 | 100% | 89% | 80% |
| November 2026 | 100% | 82% | 81% |
Content is scannable in self-contained chunks
Counting every site scanned in November 2026, 86% of the sites we could read passed the “Content is scannable in self-contained chunks” check. On the sites scanned in both October 2026 and November 2026, the share went from 85% to 86%.
Line: Same sites Line: All sites (new ones included)
Show as a table
Content is scannable in self-contained chunks, share of sites by month | Month | Applies to | All sites (new ones included) | Same sites |
|---|
| October 2026 | 100% | 95% | 85% |
| November 2026 | 100% | 86% | 86% |
Your answer is in the HTML
Counting every site scanned in November 2026, 93% of the sites we could read passed the “Your answer is in the HTML” check. On the sites scanned in both October 2026 and November 2026, the share went from 91% to 92%.
Line: Same sites Line: All sites (new ones included)
Show as a table
Your answer is in the HTML, share of sites by month | Month | Applies to | All sites (new ones included) | Same sites |
|---|
| October 2026 | 100% | 96% | 91% |
| November 2026 | 100% | 93% | 92% |
Content usage preferences declared
Counting every site scanned in November 2026, 12% of the sites we could read passed the “Content usage preferences declared” check. On the sites scanned in both October 2026 and November 2026, the share went from 9% to 11%.
Line: Same sites Line: All sites (new ones included)
Show as a table
Content usage preferences declared, share of sites by month | Month | Applies to | All sites (new ones included) | Same sites |
|---|
| October 2026 | 100% | 3% | 9% |
| November 2026 | 100% | 12% | 11% |
Missing pages return a real 404
Counting every site scanned in November 2026, 83% of the sites we could read passed the “Missing pages return a real 404” check. On the sites scanned in both October 2026 and November 2026, the share went from 84% to 81%.
Line: Same sites Line: All sites (new ones included)
Show as a table
Missing pages return a real 404, share of sites by month | Month | Applies to | All sites (new ones included) | Same sites |
|---|
| October 2026 | 100% | 96% | 84% |
| November 2026 | 100% | 83% | 81% |
FAQ / Q&A schema
Counting every site scanned in November 2026, 47% of the sites where it applies (20% of the sites we could read) passed the “FAQ / Q&A schema” check. On the sites scanned in both September 2026 and October 2026, the share went from 44% to 51%.
Line: Same sites Line: All sites (new ones included)
Show as a table
FAQ / Q&A schema, share of sites by month | Month | Applies to | All sites (new ones included) | Same sites |
|---|
| August 2026 | 15% | 30% | — |
| September 2026 | 13% | 43% | 44% |
| October 2026 | 20% | 47% | 51% |
| November 2026 | 9% | — | — |
A favicon is set
Counting every site scanned in November 2026, 96% of the sites we could read passed the “A favicon is set” check. On the sites scanned in both October 2026 and November 2026, the share stayed at 96%.
Line: Same sites Line: All sites (new ones included)
Show as a table
A favicon is set, share of sites by month | Month | Applies to | All sites (new ones included) | Same sites |
|---|
| October 2026 | 100% | 99% | 96% |
| November 2026 | 100% | 96% | 96% |
A machine-readable published / updated date
Counting every site scanned in November 2026, 19% of the sites we could read passed the “A machine-readable published / updated date” check. On the sites scanned in both October 2026 and November 2026, the share went from 18% to 19%.
Line: Same sites Line: All sites (new ones included)
Show as a table
A machine-readable published / updated date, share of sites by month | Month | Applies to | All sites (new ones included) | Same sites |
|---|
| October 2026 | 100% | 8% | 18% |
| November 2026 | 100% | 19% | 19% |
Logical heading order
Counting every site scanned in November 2026, 75% of the sites we could read passed the “Logical heading order” check. On the sites scanned in both October 2026 and November 2026, the share went from 71% to 74%.
Line: Same sites Line: All sites (new ones included)
Show as a table
Logical heading order, share of sites by month | Month | Applies to | All sites (new ones included) | Same sites |
|---|
| October 2026 | 100% | 64% | 71% |
| November 2026 | 100% | 75% | 74% |
Reached without a redirect chain
Counting every site scanned in November 2026, 95% of the sites we could read passed the “Reached without a redirect chain” check. On the sites scanned in both October 2026 and November 2026, the share went from 97% to 96%.
Line: Same sites Line: All sites (new ones included)
Show as a table
Reached without a redirect chain, share of sites by month | Month | Applies to | All sites (new ones included) | Same sites |
|---|
| October 2026 | 100% | 99% | 97% |
| November 2026 | 100% | 95% | 96% |
Served over a secure HTTPS connection
Counting every site scanned in November 2026, 99% of the sites we could read passed the “Served over a secure HTTPS connection” check. On the sites scanned in both October 2026 and November 2026, the share stayed at 99%.
Line: Same sites Line: All sites (new ones included)
Show as a table
Served over a secure HTTPS connection, share of sites by month | Month | Applies to | All sites (new ones included) | Same sites |
|---|
| October 2026 | 100% | >99% | 99% |
| November 2026 | 100% | 99% | 99% |
HTTP redirects to HTTPS
Counting every site scanned in November 2026, 82% of the sites we could read passed the “HTTP redirects to HTTPS” check. On the sites scanned in both October 2026 and November 2026, the share went from 81% to 82%.
Line: Same sites Line: All sites (new ones included)
Show as a table
HTTP redirects to HTTPS, share of sites by month | Month | Applies to | All sites (new ones included) | Same sites |
|---|
| October 2026 | 100% | 96% | 81% |
| November 2026 | 100% | 82% | 82% |
Images have descriptive alt text
Counting every site scanned in November 2026, 89% of the sites where it applies (83% of the sites we could read) passed the “Images have descriptive alt text” check. On the sites scanned in both October 2026 and November 2026, the share stayed at 87%.
Line: Same sites Line: All sites (new ones included)
Show as a table
Images have descriptive alt text, share of sites by month | Month | Applies to | All sites (new ones included) | Same sites |
|---|
| October 2026 | 96% | 98% | 87% |
| November 2026 | 83% | 89% | 87% |
Images are optimised
Counting every site scanned in November 2026, 40% of the sites where it applies (83% of the sites we could read) passed the “Images are optimised” check. On the sites scanned in both October 2026 and November 2026, the share went from 38% to 39%.
Line: Same sites Line: All sites (new ones included)
Show as a table
Images are optimised, share of sites by month | Month | Applies to | All sites (new ones included) | Same sites |
|---|
| October 2026 | 96% | 11% | 38% |
| November 2026 | 83% | 40% | 39% |
Structured data is present
Counting every site scanned in November 2026, 57% of the sites we could read passed the “Structured data is present” check. On the sites scanned in both August 2026 and November 2026, the share went from 53% to 57%.
Line: Same sites Line: All sites (new ones included)
Show as a table
Structured data is present, share of sites by month | Month | Applies to | All sites (new ones included) | Same sites |
|---|
| August 2026 | 100% | 57% | 53% |
| September 2026 | 100% | 61% | 54% |
| October 2026 | 100% | 55% | 58% |
| November 2026 | 100% | 57% | 57% |
Topic is consistent across title, H1 and description
Counting every site scanned in November 2026, 64% of the sites we could read passed the “Topic is consistent across title, H1 and description” check. On the sites scanned in both October 2026 and November 2026, the share went from 61% to 64%.
Line: Same sites Line: All sites (new ones included)
Show as a table
Topic is consistent across title, H1 and description, share of sites by month | Month | Applies to | All sites (new ones included) | Same sites |
|---|
| October 2026 | 100% | 67% | 61% |
| November 2026 | 100% | 64% | 64% |
Language and charset declared
Counting every site scanned in November 2026, 89% of the sites we could read passed the “Language and charset declared” check. On the sites scanned in both October 2026 and November 2026, the share stayed at 88%.
Line: Same sites Line: All sites (new ones included)
Show as a table
Language and charset declared, share of sites by month | Month | Applies to | All sites (new ones included) | Same sites |
|---|
| October 2026 | 100% | 84% | 88% |
| November 2026 | 100% | 89% | 88% |
Resource-discovery Link headers
Counting every site scanned in November 2026, 10% of the sites we could read passed the “Resource-discovery Link headers” check. On the sites scanned in both October 2026 and November 2026, the share stayed at 11%.
Line: Same sites Line: All sites (new ones included)
Show as a table
Resource-discovery Link headers, share of sites by month | Month | Applies to | All sites (new ones included) | Same sites |
|---|
| October 2026 | 100% | 1% | 11% |
| November 2026 | 100% | 10% | 11% |
Sensible internal/external link mix
Counting every site scanned in November 2026, 92% of the sites where it applies (94% of the sites we could read) passed the “Sensible internal/external link mix” check. On the sites scanned in both October 2026 and November 2026, the share stayed at 92%.
Line: Same sites Line: All sites (new ones included)
Show as a table
Sensible internal/external link mix, share of sites by month | Month | Applies to | All sites (new ones included) | Same sites |
|---|
| October 2026 | 98% | 96% | 92% |
| November 2026 | 94% | 92% | 92% |
llms.txt is present and valid
Counting every site scanned in November 2026, 34% of the sites we could read passed the “llms.txt is present and valid” check. On the sites scanned in both August 2026 and November 2026, the share went from 32% to 35%.
Line: Same sites Line: All sites (new ones included)
Show as a table
llms.txt is present and valid, share of sites by month | Month | Applies to | All sites (new ones included) | Same sites |
|---|
| August 2026 | 100% | 30% | 32% |
| September 2026 | 100% | 28% | 31% |
| October 2026 | 100% | 29% | 35% |
| November 2026 | 100% | 34% | 35% |
Clean content for agents (Markdown)
Counting every site scanned in November 2026, 14% of the sites we could read passed the “Clean content for agents (Markdown)” check. On the sites scanned in both October 2026 and November 2026, the share went from 15% to 14%.
Line: Same sites Line: All sites (new ones included)
Show as a table
Clean content for agents (Markdown), share of sites by month | Month | Applies to | All sites (new ones included) | Same sites |
|---|
| October 2026 | 100% | 4% | 15% |
| November 2026 | 100% | 14% | 14% |
Has a meta description
Counting every site scanned in November 2026, 86% of the sites we could read passed the “Has a meta description” check. On the sites scanned in both October 2026 and November 2026, the share went from 85% to 86%.
Line: Same sites Line: All sites (new ones included)
Show as a table
Has a meta description, share of sites by month | Month | Applies to | All sites (new ones included) | Same sites |
|---|
| October 2026 | 100% | 94% | 85% |
| November 2026 | 100% | 86% | 86% |
No meta-refresh redirect
Counting every site scanned in November 2026, 96% of the sites we could read passed the “No meta-refresh redirect” check. On the sites scanned in both October 2026 and November 2026, the share stayed at 97%.
Line: Same sites Line: All sites (new ones included)
Show as a table
No meta-refresh redirect, share of sites by month | Month | Applies to | All sites (new ones included) | Same sites |
|---|
| October 2026 | 100% | >99% | 97% |
| November 2026 | 100% | 96% | 97% |
Not accidentally set to noindex
Counting every site scanned in November 2026, 99% of the sites we could read passed the “Not accidentally set to noindex” check. On the sites scanned in both October 2026 and November 2026, the share stayed at 100%.
Line: Same sites Line: All sites (new ones included)
Show as a table
Not accidentally set to noindex, share of sites by month | Month | Applies to | All sites (new ones included) | Same sites |
|---|
| October 2026 | 100% | 99% | 100% |
| November 2026 | 100% | 99% | 100% |
No mixed (insecure) content
Counting every site scanned in November 2026, 99% of the sites we could read passed the “No mixed (insecure) content” check. On the sites scanned in both October 2026 and November 2026, the share stayed at 99%.
Line: Same sites Line: All sites (new ones included)
Show as a table
No mixed (insecure) content, share of sites by month | Month | Applies to | All sites (new ones included) | Same sites |
|---|
| October 2026 | 100% | 99% | 99% |
| November 2026 | 100% | 99% | 99% |
Open Graph tags for sharing
Counting every site scanned in November 2026, 60% of the sites we could read passed the “Open Graph tags for sharing” check. On the sites scanned in both October 2026 and November 2026, the share went from 60% to 59%.
Line: Same sites Line: All sites (new ones included)
Show as a table
Open Graph tags for sharing, share of sites by month | Month | Applies to | All sites (new ones included) | Same sites |
|---|
| October 2026 | 100% | 18% | 60% |
| November 2026 | 100% | 60% | 59% |
Organization schema with sameAs
Counting every site scanned in November 2026, 31% of the sites we could read passed the “Organization schema with sameAs” check. On the sites scanned in both August 2026 and November 2026, the share went from 30% to 31%.
Line: Same sites Line: All sites (new ones included)
Show as a table
Organization schema with sameAs, share of sites by month | Month | Applies to | All sites (new ones included) | Same sites |
|---|
| August 2026 | 100% | 33% | 30% |
| September 2026 | 100% | 31% | 29% |
| October 2026 | 100% | 34% | 31% |
| November 2026 | 100% | 31% | 31% |
Links don't point at redirects
Counting every site scanned in November 2026, 81% of the sites where it applies (88% of the sites we could read) passed the “Links don't point at redirects” check. On the sites scanned in both October 2026 and November 2026, the share stayed at 84%.
Line: Same sites Line: All sites (new ones included)
Show as a table
Links don't point at redirects, share of sites by month | Month | Applies to | All sites (new ones included) | Same sites |
|---|
| October 2026 | 96% | 95% | 84% |
| November 2026 | 88% | 81% | 84% |
robots.txt is present and not over-blocking
Counting every site scanned in November 2026, 88% of the sites we could read passed the “robots.txt is present and not over-blocking” check. On the sites scanned in both October 2026 and November 2026, the share stayed at 88%.
Line: Same sites Line: All sites (new ones included)
Show as a table
robots.txt is present and not over-blocking, share of sites by month | Month | Applies to | All sites (new ones included) | Same sites |
|---|
| October 2026 | 100% | 92% | 88% |
| November 2026 | 100% | 88% | 88% |
Not flagged for malware or phishing
Counting every site scanned in November 2026, 100% of the sites we could read passed the “Not flagged for malware or phishing” check. On the sites scanned in both October 2026 and November 2026, the share stayed at 100%.
Line: Same sites Line: All sites (new ones included)
Show as a table
Not flagged for malware or phishing, share of sites by month | Month | Applies to | All sites (new ones included) | Same sites |
|---|
| October 2026 | >99% | 100% | 100% |
| November 2026 | 100% | 100% | 100% |
Search Console / Bing verification
Counting every site scanned in November 2026, 82% of the sites we could read passed the “Search Console / Bing verification” check. On the sites scanned in both October 2026 and November 2026, the share stayed at 86%.
Line: Same sites Line: All sites (new ones included)
Show as a table
Search Console / Bing verification, share of sites by month | Month | Applies to | All sites (new ones included) | Same sites |
|---|
| October 2026 | 100% | 82% | 86% |
| November 2026 | 100% | 82% | 86% |
Core security headers are set
Counting every site scanned in November 2026, 21% of the sites we could read passed the “Core security headers are set” check. On the sites scanned in both October 2026 and November 2026, the share stayed at 24%.
Line: Same sites Line: All sites (new ones included)
Show as a table
Core security headers are set, share of sites by month | Month | Applies to | All sites (new ones included) | Same sites |
|---|
| October 2026 | 100% | 6% | 24% |
| November 2026 | 100% | 21% | 24% |
security.txt is published
Counting every site scanned in November 2026, 21% of the sites we could read passed the “security.txt is published” check. On the sites scanned in both October 2026 and November 2026, the share went from 24% to 23%.
Line: Same sites Line: All sites (new ones included)
Show as a table
security.txt is published, share of sites by month | Month | Applies to | All sites (new ones included) | Same sites |
|---|
| October 2026 | 100% | 4% | 24% |
| November 2026 | 100% | 21% | 23% |
Semantic HTML landmarks
Counting every site scanned in November 2026, 71% of the sites we could read passed the “Semantic HTML landmarks” check. On the sites scanned in both October 2026 and November 2026, the share went from 70% to 71%.
Line: Same sites Line: All sites (new ones included)
Show as a table
Semantic HTML landmarks, share of sites by month | Month | Applies to | All sites (new ones included) | Same sites |
|---|
| October 2026 | 100% | 49% | 70% |
| November 2026 | 100% | 71% | 71% |
No server version leakage
Counting every site scanned in November 2026, 84% of the sites we could read passed the “No server version leakage” check. On the sites scanned in both October 2026 and November 2026, the share stayed at 84%.
Line: Same sites Line: All sites (new ones included)
Show as a table
No server version leakage, share of sites by month | Month | Applies to | All sites (new ones included) | Same sites |
|---|
| October 2026 | 100% | 95% | 84% |
| November 2026 | 100% | 84% | 84% |
The page has an H1
Counting every site scanned in November 2026, 71% of the sites we could read passed the “The page has an H1” check. On the sites scanned in both October 2026 and November 2026, the share went from 67% to 68%.
Line: Same sites Line: All sites (new ones included)
Show as a table
The page has an H1, share of sites by month | Month | Applies to | All sites (new ones included) | Same sites |
|---|
| October 2026 | 100% | 90% | 67% |
| November 2026 | 100% | 71% | 68% |
XML sitemap is present and referenced
Counting every site scanned in November 2026, 66% of the sites we could read passed the “XML sitemap is present and referenced” check. On the sites scanned in both August 2026 and November 2026, the share went from 68% to 69%.
Line: Same sites Line: All sites (new ones included)
Show as a table
XML sitemap is present and referenced, share of sites by month | Month | Applies to | All sites (new ones included) | Same sites |
|---|
| August 2026 | 100% | 69% | 68% |
| September 2026 | 100% | 71% | 69% |
| October 2026 | 100% | 77% | 69% |
| November 2026 | 100% | 66% | 69% |
Has a title tag
Counting every site scanned in November 2026, 99% of the sites we could read passed the “Has a title tag” check. On the sites scanned in both October 2026 and November 2026, the share stayed at 99%.
Line: Same sites Line: All sites (new ones included)
Show as a table
Has a title tag, share of sites by month | Month | Applies to | All sites (new ones included) | Same sites |
|---|
| October 2026 | 100% | >99% | 99% |
| November 2026 | 100% | 99% | 99% |
Twitter/X card tags
Counting every site scanned in November 2026, 70% of the sites we could read passed the “Twitter/X card tags” check. On the sites scanned in both October 2026 and November 2026, the share stayed at 69%.
Line: Same sites Line: All sites (new ones included)
Show as a table
Twitter/X card tags, share of sites by month | Month | Applies to | All sites (new ones included) | Same sites |
|---|
| October 2026 | 100% | 75% | 69% |
| November 2026 | 100% | 70% | 69% |
Mobile viewport is set
Counting every site scanned in November 2026, 79% of the sites we could read passed the “Mobile viewport is set” check. On the sites scanned in both October 2026 and November 2026, the share went from 76% to 77%.
Line: Same sites Line: All sites (new ones included)
Show as a table
Mobile viewport is set, share of sites by month | Month | Applies to | All sites (new ones included) | Same sites |
|---|
| October 2026 | 100% | 96% | 76% |
| November 2026 | 100% | 79% | 77% |
Structured data is valid
Counting every site scanned in November 2026, 98% of the sites where it applies (56% of the sites we could read) passed the “Structured data is valid” check. On the sites scanned in both October 2026 and November 2026, the share stayed at 98%.
Line: Same sites Line: All sites (new ones included)
Show as a table
Structured data is valid, share of sites by month | Month | Applies to | All sites (new ones included) | Same sites |
|---|
| October 2026 | 55% | 97% | 98% |
| November 2026 | 56% | 98% | 98% |
Right schema type for the page
Counting every site scanned in November 2026, 87% of the sites where it applies (56% of the sites we could read) passed the “Right schema type for the page” check. On the sites scanned in both October 2026 and November 2026, the share stayed at 85%.
Line: Same sites Line: All sites (new ones included)
Show as a table
Right schema type for the page, share of sites by month | Month | Applies to | All sites (new ones included) | Same sites |
|---|
| October 2026 | 55% | 96% | 85% |
| November 2026 | 56% | 87% | 85% |
Title fits a search snippet
Counting every site scanned in November 2026, 45% of the sites where it applies (99% of the sites we could read) passed the “Title fits a search snippet” check. On the sites scanned in both October 2026 and November 2026, the share stayed at 46%.
Line: Same sites Line: All sites (new ones included)
Show as a table
Title fits a search snippet, share of sites by month | Month | Applies to | All sites (new ones included) | Same sites |
|---|
| October 2026 | >99% | 60% | 46% |
| November 2026 | 99% | 45% | 46% |
Breadcrumb structured data
Counting every site scanned in November 2026, 30% of the sites where it applies (2% of the sites we could read) passed the “Breadcrumb structured data” check.
Line: Same sites Line: All sites (new ones included)
Show as a table
Breadcrumb structured data, share of sites by month | Month | Applies to | All sites (new ones included) | Same sites |
|---|
| August 2026 | 9% | — | — |
| September 2026 | 17% | 29% | — |
| October 2026 | 2% | 30% | 30% |
| November 2026 | 7% | — | — |
AI catalog
Counting every site scanned in November 2026, 6% of the sites we could read passed the “AI catalog” check. On the sites scanned in both October 2026 and November 2026, the share stayed at 6%.
Line: Same sites Line: All sites (new ones included)
Show as a table
AI catalog, share of sites by month | Month | Applies to | All sites (new ones included) | Same sites |
|---|
| October 2026 | 100% | 1% | 6% |
| November 2026 | 100% | 6% | 6% |
Your content survives without JavaScript
Counting every site scanned in November 2026, 92% of the sites we could read passed the “Your content survives without JavaScript” check. On the sites scanned in both October 2026 and November 2026, the share stayed at 91%.
Line: Same sites Line: All sites (new ones included)
Show as a table
Your content survives without JavaScript, share of sites by month | Month | Applies to | All sites (new ones included) | Same sites |
|---|
| October 2026 | 100% | 97% | 91% |
| November 2026 | 100% | 92% | 91% |
A2A Agent Card
Counting every site scanned in November 2026, 4% of the sites we could read passed the “A2A Agent Card” check. On the sites scanned in both October 2026 and November 2026, the share stayed at 4%.
Line: Same sites Line: All sites (new ones included)
Show as a table
A2A Agent Card, share of sites by month | Month | Applies to | All sites (new ones included) | Same sites |
|---|
| October 2026 | >99% | <1% | 4% |
| November 2026 | 100% | 4% | 4% |
AI usage preferences (Content-Usage)
Counting every site scanned in November 2026, 0% of the sites we could read passed the “AI usage preferences (Content-Usage)” check. On the sites scanned in both October 2026 and November 2026, the share stayed at 0%.
Line: Same sites Line: All sites (new ones included)
Show as a table
AI usage preferences (Content-Usage), share of sites by month | Month | Applies to | All sites (new ones included) | Same sites |
|---|
| October 2026 | >99% | <1% | 0% |
| November 2026 | 100% | 0% | 0% |
Markdown version linked from the page
Counting every site scanned in November 2026, 7% of the sites we could read passed the “Markdown version linked from the page” check. On the sites scanned in both October 2026 and November 2026, the share stayed at 8%.
Line: Same sites Line: All sites (new ones included)
Show as a table
Markdown version linked from the page, share of sites by month | Month | Applies to | All sites (new ones included) | Same sites |
|---|
| October 2026 | >99% | 1% | 8% |
| November 2026 | 100% | 7% | 8% |
Licensing terms for AI (RSL)
Counting every site scanned in November 2026, 0% of the sites we could read passed the “Licensing terms for AI (RSL)” check. On the sites scanned in both October 2026 and November 2026, the share stayed at 0%.
Line: Same sites Line: All sites (new ones included)
Show as a table
Licensing terms for AI (RSL), share of sites by month | Month | Applies to | All sites (new ones included) | Same sites |
|---|
| October 2026 | >99% | <1% | 0% |
| November 2026 | 100% | 0% | 0% |
Text-and-data-mining reservation (TDMRep)
Counting every site scanned in November 2026, 0% of the sites we could read passed the “Text-and-data-mining reservation (TDMRep)” check. On the sites scanned in both October 2026 and November 2026, the share stayed at 0%.
Line: Same sites Line: All sites (new ones included)
Show as a table
Text-and-data-mining reservation (TDMRep), share of sites by month | Month | Applies to | All sites (new ones included) | Same sites |
|---|
| October 2026 | >99% | <1% | 0% |
| November 2026 | 100% | 0% | 0% |
WebMCP tools in the page
Counting every site scanned in November 2026, 3% of the sites we could read passed the “WebMCP tools in the page” check. On the sites scanned in both October 2026 and November 2026, the share stayed at 3%.
Line: Same sites Line: All sites (new ones included)
Show as a table
WebMCP tools in the page, share of sites by month | Month | Applies to | All sites (new ones included) | Same sites |
|---|
| October 2026 | >99% | <1% | 3% |
| November 2026 | 100% | 3% | 3% |
Buttons, links and fields have names
Counting every site scanned in November 2026, 52% of the sites where it applies (94% of the sites we could read) passed the “Buttons, links and fields have names” check. On the sites scanned in both October 2026 and November 2026, the share stayed at 54%.
Line: Same sites Line: All sites (new ones included)
Show as a table
Buttons, links and fields have names, share of sites by month | Month | Applies to | All sites (new ones included) | Same sites |
|---|
| October 2026 | 98% | 30% | 54% |
| November 2026 | 94% | 52% | 54% |
Claims come with figures, quotes or sources
Counting every site scanned in November 2026, 56% of the sites where it applies (72% of the sites we could read) passed the “Claims come with figures, quotes or sources” check. On the sites scanned in both October 2026 and November 2026, the share went from 60% to 59%.
Line: Same sites Line: All sites (new ones included)
Show as a table
Claims come with figures, quotes or sources, share of sites by month | Month | Applies to | All sites (new ones included) | Same sites |
|---|
| October 2026 | 80% | 55% | 60% |
| November 2026 | 72% | 56% | 59% |
Your page's HTML isn't oversized
Counting every site scanned in November 2026, 95% of the sites we could read passed the “Your page's HTML isn't oversized” check. On the sites scanned in both October 2026 and November 2026, the share stayed at 96%.
Line: Same sites Line: All sites (new ones included)
Show as a table
Your page's HTML isn't oversized, share of sites by month | Month | Applies to | All sites (new ones included) | Same sites |
|---|
| October 2026 | >99% | 99% | 96% |
| November 2026 | 100% | 95% | 96% |
Description fits a search snippet
Counting every site scanned in November 2026, 66% of the sites where it applies (86% of the sites we could read) passed the “Description fits a search snippet” check. On the sites scanned in both October 2026 and November 2026, the share went from 63% to 64%.
Line: Same sites Line: All sites (new ones included)
Show as a table
Description fits a search snippet, share of sites by month | Month | Applies to | All sites (new ones included) | Same sites |
|---|
| October 2026 | 94% | 65% | 63% |
| November 2026 | 86% | 66% | 64% |
Section headings are phrased as questions
Counting every site scanned in November 2026, 31% of the sites where it applies (65% of the sites we could read) passed the “Section headings are phrased as questions” check. On the sites scanned in both October 2026 and November 2026, the share stayed at 33%.
Line: Same sites Line: All sites (new ones included)
Show as a table
Section headings are phrased as questions, share of sites by month | Month | Applies to | All sites (new ones included) | Same sites |
|---|
| October 2026 | 77% | 22% | 33% |
| November 2026 | 65% | 31% | 33% |
Your page arrives quickly
Counting every site scanned in November 2026, 91% of the sites we could read passed the “Your page arrives quickly” check. On the sites scanned in both October 2026 and November 2026, the share went from 94% to 93%.
Line: Same sites Line: All sites (new ones included)
Show as a table
Your page arrives quickly, share of sites by month | Month | Applies to | All sites (new ones included) | Same sites |
|---|
| October 2026 | >99% | 97% | 94% |
| November 2026 | 100% | 91% | 93% |
Engines are allowed to quote the page
Counting every site scanned in November 2026, 93% of the sites we could read passed the “Engines are allowed to quote the page” check. On the sites scanned in both October 2026 and November 2026, the share stayed at 93%.
Line: Same sites Line: All sites (new ones included)
Show as a table
Engines are allowed to quote the page, share of sites by month | Month | Applies to | All sites (new ones included) | Same sites |
|---|
| October 2026 | >99% | 99% | 93% |
| November 2026 | 100% | 93% | 93% |
Links are real links
Counting every site scanned in November 2026, 90% of the sites where it applies (94% of the sites we could read) passed the “Links are real links” check. On the sites scanned in both October 2026 and November 2026, the share went from 90% to 91%.
Line: Same sites Line: All sites (new ones included)
Show as a table
Links are real links, share of sites by month | Month | Applies to | All sites (new ones included) | Same sites |
|---|
| October 2026 | 98% | 93% | 90% |
| November 2026 | 94% | 90% | 91% |
Organization markup
Counting every site scanned in November 2026, 33% of the sites we could read published Organization structured data as a type of its own. On the sites scanned in both August 2026 and November 2026, the share went from 27% to 30%.
Line: Same sites Line: All sites (new ones included)
Show as a table
Organization markup, share of sites by month | Month | All sites (new ones included) | Same sites |
|---|
| August 2026 | 30% | 27% |
| September 2026 | 35% | 29% |
| October 2026 | 36% | 31% |
| November 2026 | 33% | 30% |
WebSite markup
Counting every site scanned in November 2026, 36% of the sites we could read published WebSite structured data as a type of its own. On the sites scanned in both August 2026 and November 2026, the share went from 35% to 34%.
Line: Same sites Line: All sites (new ones included)
Show as a table
WebSite markup, share of sites by month | Month | All sites (new ones included) | Same sites |
|---|
| August 2026 | 33% | 35% |
| September 2026 | 38% | 33% |
| October 2026 | 27% | 34% |
| November 2026 | 36% | 34% |
WebPage markup
Counting every site scanned in November 2026, 20% of the sites we could read published WebPage structured data as a type of its own. On the sites scanned in both August 2026 and November 2026, the share went from 17% to 19%.
Line: Same sites Line: All sites (new ones included)
Show as a table
WebPage markup, share of sites by month | Month | All sites (new ones included) | Same sites |
|---|
| August 2026 | 21% | 17% |
| September 2026 | 23% | 18% |
| October 2026 | 18% | 19% |
| November 2026 | 20% | 19% |
SoftwareApplication markup
Counting every site scanned in November 2026, 7% of the sites we could read published SoftwareApplication structured data as a type of its own. On the sites scanned in both August 2026 and November 2026, the share went from 6% to 7%.
Line: Same sites Line: All sites (new ones included)
Show as a table
SoftwareApplication markup, share of sites by month | Month | All sites (new ones included) | Same sites |
|---|
| August 2026 | 7% | 6% |
| September 2026 | 5% | 7% |
| October 2026 | 8% | 7% |
| November 2026 | 7% | 7% |
Service markup
Counting every site scanned in November 2026, 2% of the sites we could read published Service structured data as a type of its own. On the sites scanned in both August 2026 and November 2026, the share stayed at 2%.
Line: Same sites Line: All sites (new ones included)
Show as a table
Service markup, share of sites by month | Month | All sites (new ones included) | Same sites |
|---|
| August 2026 | 2% | 2% |
| September 2026 | 1% | 2% |
| October 2026 | 2% | 2% |
| November 2026 | 2% | 2% |
FAQPage markup
Counting every site scanned in November 2026, 3% of the sites we could read published FAQPage structured data as a type of its own. On the sites scanned in both August 2026 and November 2026, the share stayed at 2%.
Line: Same sites Line: All sites (new ones included)
Show as a table
FAQPage markup, share of sites by month | Month | All sites (new ones included) | Same sites |
|---|
| August 2026 | 4% | 2% |
| September 2026 | 6% | 3% |
| October 2026 | 7% | 3% |
| November 2026 | 3% | 2% |
Article markup
Counting every site scanned in November 2026, 7% of the sites we could read published Article structured data as a type of its own. On the sites scanned in both August 2026 and November 2026, the share stayed at 6%.
Line: Same sites Line: All sites (new ones included)
Show as a table
Article markup, share of sites by month | Month | All sites (new ones included) | Same sites |
|---|
| August 2026 | 3% | 6% |
| September 2026 | 4% | 6% |
| October 2026 | 1% | 6% |
| November 2026 | 7% | 6% |
TechArticle markup
Counting every site scanned in November 2026, 4% of the sites we could read published TechArticle structured data as a type of its own. On the sites scanned in both August 2026 and November 2026, the share went from 3% to 4%.
Line: Same sites Line: All sites (new ones included)
Show as a table
TechArticle markup, share of sites by month | Month | All sites (new ones included) | Same sites |
|---|
| August 2026 | 1% | 3% |
| September 2026 | 1% | 4% |
| October 2026 | <1% | 4% |
| November 2026 | 4% | 4% |
NewsMediaOrganization markup
Counting every site scanned in November 2026, 6% of the sites we could read published NewsMediaOrganization structured data as a type of its own. On the sites scanned in both August 2026 and November 2026, the share went from 8% to 6%.
Line: Same sites Line: All sites (new ones included)
Show as a table
NewsMediaOrganization markup, share of sites by month | Month | All sites (new ones included) | Same sites |
|---|
| August 2026 | 4% | 8% |
| September 2026 | 3% | 6% |
| October 2026 | <1% | 6% |
| November 2026 | 6% | 6% |
ItemList markup
Counting every site scanned in November 2026, 2% of the sites we could read published ItemList structured data as a type of its own. On the sites scanned in both August 2026 and November 2026, the share stayed at 2%.
Line: Same sites Line: All sites (new ones included)
Show as a table
ItemList markup, share of sites by month | Month | All sites (new ones included) | Same sites |
|---|
| August 2026 | 2% | 2% |
| September 2026 | 3% | 3% |
| October 2026 | 2% | 3% |
| November 2026 | 2% | 2% |
Person markup
Counting every site scanned in November 2026, 5% of the sites we could read published Person structured data as a type of its own. On the sites scanned in both August 2026 and November 2026, the share stayed at 4%.
Line: Same sites Line: All sites (new ones included)
Show as a table
Person markup, share of sites by month | Month | All sites (new ones included) | Same sites |
|---|
| August 2026 | 7% | 4% |
| September 2026 | 7% | 4% |
| October 2026 | 3% | 4% |
| November 2026 | 5% | 4% |
BreadcrumbList markup
Counting every site scanned in November 2026, 7% of the sites we could read published BreadcrumbList structured data as a type of its own. On the sites scanned in both August 2026 and November 2026, the share went from 5% to 7%.
Line: Same sites Line: All sites (new ones included)
Show as a table
BreadcrumbList markup, share of sites by month | Month | All sites (new ones included) | Same sites |
|---|
| August 2026 | 7% | 5% |
| September 2026 | 15% | 6% |
| October 2026 | 5% | 7% |
| November 2026 | 7% | 7% |
Place markup
Counting every site scanned in November 2026, 0% of the sites we could read published Place structured data as a type of its own. On the sites scanned in both August 2026 and November 2026, the share stayed at 0%.
Line: Same sites Line: All sites (new ones included)
Show as a table
Place markup, share of sites by month | Month | All sites (new ones included) | Same sites |
|---|
| August 2026 | <1% | 0% |
| September 2026 | 2% | 0% |
| October 2026 | 1% | 0% |
| November 2026 | 0% | 0% |
ImageObject markup
Counting every site scanned in November 2026, 4% of the sites we could read published ImageObject structured data as a type of its own. On the sites scanned in both August 2026 and November 2026, the share went from 2% to 3%.
Line: Same sites Line: All sites (new ones included)
Show as a table
ImageObject markup, share of sites by month | Month | All sites (new ones included) | Same sites |
|---|
| August 2026 | 4% | 2% |
| September 2026 | 9% | 2% |
| October 2026 | 3% | 3% |
| November 2026 | 4% | 3% |
LocalBusiness markup
Counting every site scanned in November 2026, 0% of the sites we could read published LocalBusiness structured data as a type of its own. On the sites scanned in both August 2026 and November 2026, the share stayed at 0%.
Line: Same sites Line: All sites (new ones included)
Show as a table
LocalBusiness markup, share of sites by month | Month | All sites (new ones included) | Same sites |
|---|
| August 2026 | 2% | 0% |
| September 2026 | 4% | 0% |
| October 2026 | 5% | 0% |
| November 2026 | 0% | 0% |
ProfessionalService markup
Counting every site scanned in November 2026, 0% of the sites we could read published ProfessionalService structured data as a type of its own. On the sites scanned in both August 2026 and November 2026, the share stayed at 0%.
Line: Same sites Line: All sites (new ones included)
Show as a table
ProfessionalService markup, share of sites by month | Month | All sites (new ones included) | Same sites |
|---|
| August 2026 | 3% | 0% |
| September 2026 | 2% | 0% |
| October 2026 | 3% | 0% |
| November 2026 | 0% | 0% |
CollectionPage markup
Counting every site scanned in November 2026, 6% of the sites we could read published CollectionPage structured data as a type of its own. On the sites scanned in both August 2026 and November 2026, the share stayed at 6%.
Line: Same sites Line: All sites (new ones included)
Show as a table
CollectionPage markup, share of sites by month | Month | All sites (new ones included) | Same sites |
|---|
| August 2026 | 4% | 6% |
| September 2026 | 3% | 6% |
| October 2026 | <1% | 6% |
| November 2026 | 6% | 6% |
Corporation markup
Counting every site scanned in November 2026, 2% of the sites we could read published Corporation structured data as a type of its own. On the sites scanned in both August 2026 and November 2026, the share stayed at 2%.
Line: Same sites Line: All sites (new ones included)
Show as a table
Corporation markup, share of sites by month | Month | All sites (new ones included) | Same sites |
|---|
| August 2026 | 2% | 2% |
| September 2026 | 1% | 2% |
| October 2026 | 2% | 2% |
| November 2026 | 2% | 2% |
ProfilePage markup
Counting every site scanned in November 2026, 0% of the sites we could read published ProfilePage structured data as a type of its own. On the sites scanned in both August 2026 and November 2026, the share stayed at 0%.
Line: Same sites Line: All sites (new ones included)
Show as a table
ProfilePage markup, share of sites by month | Month | All sites (new ones included) | Same sites |
|---|
| August 2026 | 1% | 0% |
| September 2026 | 1% | 0% |
| October 2026 | 1% | 0% |
| November 2026 | 0% | 0% |
NewsArticle markup
Counting every site scanned in November 2026, 0% of the sites we could read published NewsArticle structured data as a type of its own. On the sites scanned in both August 2026 and November 2026, the share stayed at 0%.
Line: Same sites Line: All sites (new ones included)
Show as a table
NewsArticle markup, share of sites by month | Month | All sites (new ones included) | Same sites |
|---|
| August 2026 | <1% | 0% |
| September 2026 | 2% | 0% |
| October 2026 | <1% | 0% |
| November 2026 | 0% | 0% |
SiteNavigationElement markup
Counting every site scanned in November 2026, 0% of the sites we could read published SiteNavigationElement structured data as a type of its own. On the sites scanned in both August 2026 and November 2026, the share stayed at 0%.
Line: Same sites Line: All sites (new ones included)
Show as a table
SiteNavigationElement markup, share of sites by month | Month | All sites (new ones included) | Same sites |
|---|
| August 2026 | 0% | 0% |
| September 2026 | 1% | 0% |
| October 2026 | <1% | 0% |
| November 2026 | 0% | 0% |
Sites scoring 91–100
Counting every site scanned in November 2026, 34% of the sites we scanned scored 91–100. On the sites scanned in both October 2026 and November 2026, the share went from 36% to 35%.
Line: Same sites Line: All sites (new ones included)
Show as a table
Sites scoring 91–100, share of sites by month | Month | All sites (new ones included) | Same sites |
|---|
| October 2026 | 42% | 36% |
| November 2026 | 34% | 35% |
Sites scoring 81–90
Counting every site scanned in November 2026, 27% of the sites we scanned scored 81–90.
Line: Same sites Line: All sites (new ones included)
Show as a table
Sites scoring 81–90, share of sites by month | Month | All sites (new ones included) | Same sites |
|---|
| October 2026 | 35% | — |
| November 2026 | 27% | 27% |
Turned our scanner away
Counting every site scanned in November 2026, 17% of the sites we scanned turned our scanner away. On the sites scanned in both October 2026 and November 2026, the share stayed at 18%.
Line: Same sites Line: All sites (new ones included)
Show as a table
Turned our scanner away, share of sites by month | Month | All sites (new ones included) | Same sites |
|---|
| October 2026 | 2% | 18% |
| November 2026 | 17% | 18% |
Checks that have only one month of figures are not listed here again: their latest figure is in Every check.
Based on the sites Bot Appétit has scanned. Most of these sites come from lists we scan for research. Not a random sample of the web.